In this chapter, we see the work of Bradley Cowan revealing hidden structures in time that can be harnessed, understood and mapped out to predict the behavior of the stock market.
We then look into Wilcock’s discoveries of a larger-order cycle in the Galaxy that is built up from the same principles as the Nineveh Constant.
This lends dramatic assistance in understanding Ra’s teachings, then made complete as we determine a scientific basis for the combination three Solar Cycles into one.
With this chapter we will directly see the harmonic structures that are visible in time, and the direct geometry that goes along with them. Once we have done so, the theoretical foundations for the universal applicability of the Nineveh Constant will be easily seen, as our Galaxy is also operating under these harmonic geometries in time.
So obviously, the very first question that comes to mind is this: even if we knew that we were looking for Platonic geometry, how could we chart out the passage of time in such a way as to have a solid measurement of its effects that might allow us to see such a structure?
Almost all graphs that we see, regardless of what phenomena in time that they are measuring, are expressed in two dimensions — an X axis and a Y axis. How would we be able to use such a graph to visualize a Z axis and thereby extend our perception of the effects of time out into three dimensions?
The even more fundamental question is this: “How do we know whether time is simply a static, “linear” phenomenon that produces no changes within nature in and of itself as it passes by, or an active, “topological” phenomenon that produces predictable, recurring patterns in neatly organized cycles?”
What possibly could we look for in trying to discover if time has a dynamic shape? In order to hope to see a shape of any kind, we would have to find something that changes, something that does not stay the same but has the potential to move in different, measurable directions.
We have already shown the proof that Light itself has just such an active, topological structure — and our one of our original arguments, seen in both the “Unified Field” theories of John Nordberg and Dewey Larson, is that all of Space is filled with a sea of Light that we do not normally observe.
Our scientific evidence as well as excerpts from Ra and W.B. Smith’s UFO lecture suggest that these Light harmonics have different density levels in different areas of the Universe.
The Sun had been maintaining the octahedral level nicely for us, even though the Ulysses probe did not detect any polarized magnetic field in 1995.
Furthermore, all of the sources we have just mentioned are telling us that Time itself is a function of Light. In the case of John Nordberg’s physics, he explains that all of the universe is made up of balls of light, which we have called Consciousness Units.
In Nordberg’s model, (which will be covered in much more detail in the next volume,) these balls of light can either remain stationary as “standing waves” (as in the case of ball lightning) or move at the speed of Light, becoming “moving waves” or photons that create visible light.
Even though a “standing wave” does not appear to be moving through space, it certainly possesses dynamic internal motion — and this will be a motion that corresponds to its own frequency of vibration.
In the case of the third dimension or density, our light harmonic is 144, and the Hindu geometric cosmology tells us that Light forms the structure of an octahedron in our area.

And so, the ultimate assertion that we will make is that motion is what creates “standing waves” of Light, which will naturally form spherical harmonics in models such as Nordberg’s.
The motion of a large body, such as a planet or star, will create harmonics as it drags along the aether in its motion, thus creating a “standing wave” in the System that it is contained within.
Wherever the center of gravity is, such as the Sun in the Solar System or the Center in the Galaxy, the harmonics will arrange themselves around that point.
In other words, any large mass must draw in the Light of Space around itself to sustain its existence, becoming an ‘aether sink’ to the surrounding area in the same manner as a low-pressure zone in our atmosphere causes high-pressure air to move into it, thus creating thunderstorms.
When you have such a sink in motion, such as in the orbit of a planet or galaxy, it naturally disturbs its environment and creates vibration as it travels, just as the froth of water that follows a motorboat continues to ripple outwards after it has passed by a certain area.
And in the case of the disruption of aetheric energy, we know from many researchers that these vibrations can be seen as light, sound and geometry.
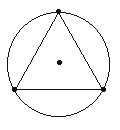
We have discussed previously the fact that Jupiter-Saturn conjunctions are the main ‘driver’ for the Mayan Calendar. What we have not mentioned is that these conjunctions always happen in the exact same three areas of space, relative to the Sun.
These areas are equally spaced and thus form a great equilateral triangle:
 Furthermore, each 19.86-year J-S conjunction is also very close to one-quarter the total length of Uranus’ orbit.
Again, in previous times this may have been more exact than it is at present, due to the explosion of Maldek.
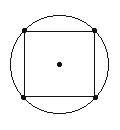
So if we divide Uranus’ 84-year orbit into similarly harmonic quarter-cycles, we end up with a giant square that is formed in its orbit around the Sun.
This is also a harmonic that is seen to overlap with the Mayan katun and / or the J-S conjunction:
 Other planetary cycles, once further explored, should yield other geometries as well, including pentagons and hexagons.
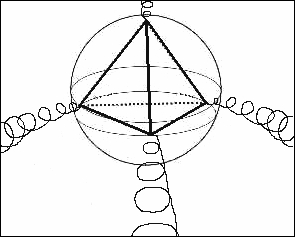
If we go back to the study of the crop circles, we remember that the work of Gerald Hawkins showed us that two-dimensional diagrams like these can in fact be hyper-extended to three dimensions.
Already, we have seen that the three-dimensional octahedron appearing in the Sun is responsible for the positive and negative energy bombardments that we receive twice a month on the Earth.
when we look at the behavior of a system such as the Great Red Spot in Jupiter at 19.5 degrees latitude, we can assume that a similar harmonic outpouring of Light energy is occurring from the tetrahedral level, slowly moving like a giant lawn sprinkler in the Solar System as Jupiter rotates:
So, the rotations of the planets and grids themselves, combined with the planet or star’s motion through space, create a variety of interconnecting harmonics.
Some of these harmonics will move very slowly compared to the speed with which our Earth passes through the Light of Space, as we complete twenty cycles around the Sun to add up to one conjunction of Jupiter and Saturn, for example.
Therefore, it is certainly possible for us to pass into and out of areas of greater or lesser energetic concentration — and this appears to be the basis of astrology.
If these energies are more than just a simple “hot-or-cold,” “high-or-low” variable and instead represent discrete archetypes of consciousness, then as certain archetypes are flooding more powerfully into our minds, we can expect that more of those corresponding personality traits in ourselves will be visible.
The entire Solar System would become a vast webwork of intertwining three-dimensional harmonics, just as an astrology chart will show you in two dimensions.
Our simplified diagram of the spiraling tetrahedron does not reveal the full extent of these harmonic pulsations. We must look at the entire shape itself as being a harmonic stress point, not just the tips.
Therefore, the exact structure of the “standing wave” in free space will act as an attracting force, causing the very lifeblood of Consciousness to be affected as all other forces pass through it.
And if we are looking for these properties in time, our next challenge would be to find a way to actually measure such changes, in order to determine if there is such a force in effect.
Since these effects are related to consciousness and thereby psychological in nature, we must find a simple way of charting out the behavior of human psychology on a mass scale.
Furthermore, if we want to insure that these changes could not possibly be caused by anything but the passage of time, then all other factors involved with the changes should be as completely random as possible.
In other words, whatever we are graphing should appear to be an almost completely unpredictable psychological phenomenon that is very easy to measure, ideally with only two “hot or cold, high or low” variables to consider.
If this behavior is truly a random event by all conventional understandings, any patterns taking effect should be a byproduct of our observable higher-dimensional geometric structures in time.
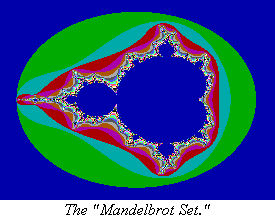
Such “patterns in chaos” have indeed been observed in many different ways already, and they are commonly referred to in modern “Chaos theory” as forming “fractal” geometries, like the Mandelbrot Set.
Until now, with our aetheric models in place, we have never truly had a foundation with which to understand how these fractal formations could be seen in both space and time.
Again, if we want to chart out human behavior to see if the passage of time has any observable effect, the first thing we have to do is to find a very, very simple index for measuring that behavior.
Ideally we should investigate some form of human behavior that essentially has only two directions — up or down, positive or negative, high or low, joy or fear, prosperity or scarcity.
This measurement of human behavior would need to be rigorously graphed day after day in an ongoing fashion in order to accurately analyze the long-term data for any trends or patterns.
In order to be truly scientific, it would have to be something that was kept fastidiously, with no interruptions, for as long as possible.
No one research group could realistically attempt to do such a broad-based study on their own, as they would be likely to introduce their own biases — and furthermore, we simply don’t have the profit motive to graph such behavior with steadfastness. Or do we?
THAT’S RIGHT… THE STOCK MARKET!
It just so happens that we do not need to look very far to find such an ongoing measurement index of human behavior.
Ever since the late 1700’s, at the dawning hour of a new nation known as the United States of America, an accurate record of the human extremes of joy and fear have been rigorously documented and rendered into the form of an ongoing graph.
This record is known to us as the stock market of the United States, later referred to as the Dow Jones Industrial Average.
Yes indeed, the final answer to proving the geometric structure of time will come to us from the study of the stock market.
As surprising as this may seem, it is indeed the most obvious and specific means by which we can graph out the extremes of human behavior through time.
The measuring index of this behavior would be the price scale, which always occupies the Y axis of a stock market graph. And thus, the relative price value of the stock market is indeed a very direct and very effective measurement device for collective human behavior.
When human beings feel joy, prosperity and inspiration, they confidently buy, buy, buy into the stock market, rising the price index.
And when human beings suddenly begin to feel fear, scarcity and panic, they quickly sell, sell, sell their stocks, hoping to bail out of the market before it gets any worse.
Indeed, any simple study of a stock market graph will show us that it continues to move up and down, up and down as time moves forward.
Rarely do we ever see a stock market graph “flatline” for any prolonged period of time, and even within the larger trends, smaller oscillations are usually seen as well.
The structures of human behavior indeed take on a dynamic shape as the collective mood of humanity rises and lowers from hope to despair, over and over again.
These cycles of human behavior have been intensely studied by many, many different researchers, as there is a very real profit motive in understanding their functions.
If it can indeed be proven that these up-and-down movements can be predicted in advance, then all the sport and intrigue of playing the stock market is eliminated.
If you know exactly when the market has bottomed out and can go no lower, then you know exactly when to buy your stock.
And if you know exactly when the market has topped out and can go no higher, then you know exactly when to sell your stock, and thus make as much of a profit as you were willing to allow yourself to make, based upon how much money you invested in the first place.
A MASONIC SCHOLAR USES “ATLANTEAN KNOWLEDGE” TO REVEAL THE HIDDEN STRUCTURE OF THE MARKET
We have already cited a great deal of evidence that suggests that the true knowledge of this octave-based system of hyperdimensional geometry that we are now discussing has been secretly known all along.
The society of Freemasons is one current guise of this “secret society” that has preserved this knowledge, which found its way into cathedral windows, the Great Seal of the United States and the United Nations Meditation Room mural, among other things.
On the outside, the Masonic Order appears to be nothing more than another boring fraternal “lodge” of aging men like the Shriners, Moose Lodge, Lions, Kiwanis or Elks Club.
To those who have spoken from the inside, there is a very complex and interwoven system of Atlantean understandings that has been handed down over time to them.
So, with the idea that everything we have discussed and more may already be known by a handful of elites upon this planet, let us investigate the work of ace stock trader W.D. Gann.

It is a documented fact that Gann was a high-level initiate in the Masonic secret society, and he actively came forward into the public to teach how very similar principles as what we have been studying could be applied to the stock market.
Gann’s work did indeed allow him and many others to make accurate predictions of market trends in certain cases, though not on a constant basis.
And now, a much more recent researcher by the name of Bradley Cowan appears to have publicized all of the unspoken and unrevealed knowledge within Gann’s works — knowledge which Gann apparently did not want to release because of his secret Masonic oaths.
This knowledge, as we shall see, was apparently first unearthed, summarized and published — at great cost to those who wanted to own it — by a man named Dr. Jerome Baumring, who died in 1992. We will have more on him in a minute.
Getting back to Cowan, it is also important to note that he is extremely secretive, never granting interviews or allowing anyone access to him.
[In the book The Carnivals of Life and Death by James Shelby Downard, we find out that anyone who breaks off from the Masons and reveals their secrets to the world is called a “Cowan”.
This is considered a spiteful label for Masons to put on someone, as of course this person is marked for death should they be apprehended.
Even on a Masonic website, we found the following. A cowan is “1. Sc. One who does the work of a mason, but has not been apprenticed to the trade. 2. Hence, One uninitiated in the secrets of Freemasonry 1707. 3. slang. A sneak, eavesdropper… applied derogatorily to one who does the work of a mason, but who has not been regularly apprenticed or bred to the trade.”
We have never tried to discuss this with Bradley Cowan and have no reason to; but it is likely, given the heaviness of his revelations, that his last name is a pseudonym chosen for this reason.]
It is quite brave for Cowan to come forward and reveal these truths, and we applaud him for it. Despite the veils of secrecy, this hidden knowledge is now public domain — and it ties directly into our understandings of time as a multi-dimensional, geometric phenomenon.
Hence, the title of the first of Cowan’s works is Four-Dimensional Stock Market Structures and Cycles.
But before we discuss Cowan and / or Baumring, we must start with Gann.
THE MARKET RESEARCH OF W.D. GANN
The essential core of Gann’s discoveries is concerned with the idea that history repeats itself.
Most of us simply have no idea how accurately and technically perfect this actually can be.
To make it more specific, Gann discovered that the combined price and time movement of the stock market will arrange itself into regular, repeating units.
Each “unit” will have the same length, and will end up pointing in a direction that can be calculated using geometry.
These units of length and direction were referred to as “radii vectors.” A vector, of course, simply represents an impulse traveling in a given direction at a given speed.
So how do we understand “radii vectors?” Simple.
Everything interesting in market trading happens at the high points, when you want to sell, and the low points, when you want to buy. As it turns out, these points do not occur by accident… they are very precisely determined by the principles of harmonics.
If you draw a straight line between the nearest high and low points on a chart, you are seeing the actual, hidden, straight-line ‘vector’ that is determining its movement.
That straight line represents a combined value of price and time.
Based on this rather simple system, once you calculate how ‘long’ your line is, as a number of “price-time” units, you automatically know that the next vector will be exactly the same length.
[Other cycles can come in and shift how all of this operates, so this is not always going to be the case… but it does remain remarkably consistent across time in most cases.]
THINK OF THE EARTH LIKE A BIG CONFERENCE ROOM…
Without a knowledge of how time could have hidden, harmonic structures in it, which precisely determine how everyone is feeling on the planet, it may seem impossible. Nonetheless, Gann gathered mountains of evidence to prove that that’s “just the way it works.”
The simplest analogy we’ve ever come up with is to think of the Earth as a big conference room that everyone is living in together. If you’ve ever attended a conference where the AC was much too strong, then you remember how terrible it felt to be freezing cold.
In terms of stock-market movement, when people start feeling too “cold,” they get nervous, anxious and worried. It’s time to close up, shut down and head to the safety zone. They sell their stocks in a wave of fear. The markets go down.
Then, when the temperature starts warming up again, people start feeling better. Now it’s time to party. Bring on the drinks, bring on the women, bring on the fun. Buy, buy, buy. The markets go up.
THE SCIENCE OF OUR CONVERGENCE FILM IN ACTION
Our CONVERGENCE film, slated for release in 2008, and the research we put together for it, goes into great detail about how our mood and attitude is directly affected by an outside energy field that unifies us in consciousness. The markets give us an excellent ‘barometer’ to see this in action.
It is important to note that the temperature analogy works just as well in the opposite direction, and that may actually be the more correct way to look at it.
The elegance of the “cold makes stocks go down, hot makes stocks go up” model is that it makes it easier to think about when you’re looking at a market graph. We’ve all seen thermometers rise and fall. It’s not as easy to visualize that as the ‘temperature’ goes down, stocks go up, and vice versa.
Think about it this way. When the overall “temperature” of the consciousness field rises, we are getting more “catalyst,” as the Law of One series would call it. Our “spiritual vibration” is increasing.
This means all the things we’ve been resisting in our lives come flying up into our faces. If we have major ‘blockages,’ then they may end up being released through very unpleasant circumstances — including accidents and other traumas to the physical body.
These esoteric teachings also tell us that if we are in harmony and meditative equilibrium, we can move through these ‘temperature increases’ without trauma and pain. In fact, we experience greater and greater spiritual insight and ability in the process.
Unfortunately, most people on Earth are not in this place. When their “vibration” is increased by the pressure of outside forces, including the positions of the planets and the relative amount of energy the Sun is releasing, everything goes to hell. They get irritated and frustrated, and they sell.
Imagine a room that is much too hot, and imagine how angry everyone starts getting if they are trapped in there and there is no relief in sight. Violence occurs across the globe when the temperature rises like this, and the markets crash.
This is why a very clean relationship between 11-year peaks in the solar cycle activity have been directly correlated with increases in wars and aggression, as well as crashes in the financial markets.
Then, as the Sun settles back down or other such cycles ease off, the overall energetic pressure on humanity reduces. We get a momentary break. The ‘temperature’ cools down for a time. It’s the equivalent of a great blast of cool air coming into an otherwise unbearably hot sauna.
In relief, people stop fighting each other. The news headlines get better. People feel better. They become inspired. They start feeling a new sense of hope. They recover from the latest increase in their ‘vibration,’ and are inspired to invest. The markets rise accordingly.
Just think about these concepts. Right now they are being presented to you as ideas. What you may not realize is that there is hard scientific proof that this is happening. We will show you some of it as this chapter goes on.
OVAL-SHAPED AREAS CONTAIN THE GRAPH’S MOVEMENT
So, to recap, we were discussing W.D. Gann’s discoveries that the markets keep moving in even, predictable patterns over time. These patterns can be drawn as straight lines between the neighboring high and low points on a graph.
Once you calculate the length of the line, as a value of price-time units, you know how far it will move the next time… once you figure out which direction it is pointing in.
And that’s not all. Once you know where your line is, another amazing thing happens.
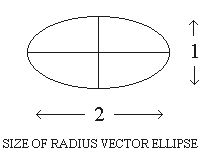
No matter which way your graph moves, it will never fall outside the boundary of a simple, harmonic oval or ellipse that can be drawn around your line!
This ellipse is the same length as the radius vector, and it will always be exactly half as wide. The next picture allows us to see this very clearly.
 Again, Gann revealed that the stock graph will never move outside of the perimeter of this ellipse, providing that you accurately know the true length and direction of the radius vector.
This information regarding the ellipse is actually very important for our final theories of hyperdimensional physics. You will soon see that we are not simply wasting space here by discussing this.
LOOK FOR CHANGES IN DIRECTION
What happens when you reach the end of a radius vector? Time to watch carefully and try to figure out which way it’s going next. You won’t figure out which way it’s going until it has already started going that way, generally speaking… but you can make an educated guess.
Here’s the trick: once you pinpoint the new direction, you will already know exactly how far it will go in terms of length before it ends. That, in turn, tells you when to buy or sell, depending on which way it’s going.
It doesn’t always bode well for the investor. In some cases, your line is almost entirely horizontal. This means you will move a long, long way in time, but the price will stay almost entirely the same. This would be a boring, “sideways choppy” market where nothing much is going to happen for a while.
The fun stuff is when you realize that you have a vector that is going up or down on a steep angle. That’s when the real action happens.
However, many investors can get tripped up by only paying attention to one cycle. These methods increase your odds, in some cases quite dramatically, but they not foolproof. It is always possible that a larger cycle you did not account for in your studies can overpower the one you were watching.
Therefore, if you want to invest money using these ideas, we strongly suggest that you purchase Bradley Cowan’s books. The ordering information is available from his website, www.cycle-trader.com. The nice thing is that he also has a computer program that allows you to run most of these cycle calculations yourself, quickly and easily, after you make it through the learning curve.
[Disclaimer: We do not profit from mentioning Cowan’s books, nor can provide you with tech support should you have any difficulty.]
SQUARING YOUR CHARTS
Getting back to our discussion of radius vectors, we mentioned that each one has a number, indicating its actual length in ‘price-time’. These numbers will keep repeating. However, when you draw out the lines on your stock market graph, they often will appear different in length.
There is one very cool way to fix this problem, called “squaring your charts.” This is a rather complicated discussion, and as we will see, Cowan devised a way to circumvent the need for it.
The key to “squaring your charts” is to establish a perfect one-to-one relationship between price and time in the chart. You want one unit of price to have the same ‘weight’ as one unit of time. Then, your radii vectors WILL look the same length on the paper — or at least much, much closer.
How in the world would we average out price and time so they are equivalent? It’s not as hard as it sounds.
First, take the overall average of a stock’s movement in price, for whatever length of time the graph is working with.
Your graph may be measuring time in lengths of hours, days, weeks or years. Whatever length of time your chart is using, figure out how much your price moves per hour, day, week or year.
Here’s a hypothetical example. Let’s say your price moves an average of 77 cents per hour. Let’s also say each hour is represented by a tiny line that is 2 millimeters apart from the next tiny line, down there on the X-axis of your graph.
Now you re-draw your graph, so on the far left-hand side Y-axis, your price goes up by exactly 77 cents… every 2 millimeters.
Now, the movement between price and time will be balanced. You see?
Lo and behold, your ‘radii vectors’ will now all appear to be just about the same length… or at least much closer, as we said. Cowan explains why they still won’t be perfect.
One of the great, hidden discoveries of this market science, which is apparently kept secret from the world by the Masonic Order and other such groups, is what happens when you look at this chart.
Each radii vector will be 60 degrees apart from the one next to it.
Precisely.
Every time.
Can you say “geometry?”
JUST USE THE PYTHAGOREAN THEOREM
If you think “squaring your charts” sounds like a lot of work, you’re right. As of 2004, Cowan has given us permission to reveal one of his secrets. By simply using the Pythagorean Theorem, you bypass the whole problem.
To simplify things, Cowan re-named the ‘radii vector’ a ‘price-time vector,’ or PTV. That makes a lot more sense — you are measuring a vector of movement in price-time.
Remember — once you know how long each vector will be, as a combined number of price-time units (like 270, for example,) then you can calculate market turns before they happen.
Let’s rekindle those old memories from math class. The Pythagorean Theorem is A squared plus B squared equals C squared, right? You got it.
Here’s how it works. Draw a line from the bottom to the top of a stock market graph — the two closest points where you see a clear bottom and a clear top.
You want to know how long that line is in price-time — you want to calculate its exact value in price-time, and come up with a single number.
The Pythagorean Theorem tells us that if we know the length of the horizontal and vertical sides of a triangle, we can calculate the length of the diagonal side, called the hypotenuse. That’s exactly what we want to do!
Therefore, all we have to do is add up how many units of time have passed on our chart, between the bottom and the top of our ‘vector’ — whether hours, days, weeks, or years. That gives us the horizontal part of the triangle.
Then, we add up how much the price has increased between the bottom and top of our ‘vector’.
Now, simply square your time number, square your price number and add them together. That’s the “A squared plus B squared” part.
Then, take the square root of whatever you get. Now you’ve got it! You know exactly how long each vector will be, in price-time.
Remember… you will keep seeing this same line length appear again and again on your chart. Even better, if you squared your chart, each line will be exactly 60 degrees apart from its next-door neighbors in the vast majority of cases.
Now, for the first time, Cowan has given us permission to use an actual graph from his series where this is demonstrated. Check it out:

If you notice that the vectors are making triangles, which appear to be three-dimensionally bent based on their relative lengths, then you are paying attention.
“I DON’T BELIEVE IT…”
For most readers, the idea that an apparently random phenomenon such as the movement of a stock’s price value in time could occur in specific, ordered intervals and vectors seems far, far too simple to be true.
However, Gann proved his case with extensive documentation beyond any shadow of a doubt. The reason why this did not become ‘common knowledge’ is because people were, and still are, making tons and tons of money off of it. If they let everyone else know, then it might not be so profitable.
Even though you can find Gann’s books in the library, many traders are still selling copies of Gann’s Master Course for Stocks, a huge compilation of Gann’s writings and lectures over many years, for absurdly expensive prices.
And people will buy them, just because of the promises of profit that are hidden within them, if they can keep and study the books long enough to understand how to do it. And here, we are really only describing the absolute basics of this enormously complicated body of information.
COWAN’S STOCK MARKET GEOMETRY
And now, enter Bradley Cowan. If we have any say in it, he will eventually be known on a very widespread public level as the man who silently turned the entire field of stock market analysis on its end at a very young age.
Cowan also made a significant breakthrough in synthesizing, simplifying and publicizing a basic form of hyperdimensional harmonic physics.
Little is known about Cowan, as he refuses to give interviews, lectures or public appearances, seeking rather to allow his books to speak for themselves. It is entirely possible that he came across this knowledge as a result of rubbing elbows with Masonic traders, namely Dr. Jerome Baumring — hence the apparent pseudonym “Cowan”.
DR. JEROME BAUMRING: AN IMPORTANT STARTING POINT
Apparently, much of what Cowan released in his 500-dollar book series was a condensed version of what also appears in Dr. Jerome Baumring’s books.
This may be why the name Baumring was once considered ‘verboten’ in Cowan’s members-only discussion group. Some have insinuated that Cowan was a student of Baumring’s, and that may well be true, as he lived until 1992 in Los Angeles.
The problem is that if you order the complete set of Baumring books at the current prices, it’s going to set you back 11,200 dollars… and that doesn’t include the supplemental materials.
Don’t bother trying to find Jerome Baumring books for sale on Amazon. We tried. There are none.
By comparison, Cowan is being very generous for releasing the key points of the knowledge at a much lower price, even if the data is, essentially, ‘borrowed.’
The other big difference between Baumring and Cowan is that Baumring was an incredible student of esoteric philosophy. Yes… very interesting!
Baumring created a web of intrigue linking stock-market investing to a spiritual quest, infused with the mystery school traditions of Egypt and elsewhere. If you’re thinking Masons would be very interested in this, then you’re on the right track.
Cowan did away with all the mysticism and philosophy and focused in solely on the scientific, technical aspects of how to analyze and understand stock market graphs. He focused, summarized and simplified (as much as is possible) the data that was most useful for actual use in market trading.
We did track down information on the enigmatic Dr. Baumring from Sacred Science, the website selling his materials. An article was written about him in the Los Angeles Herald Examiner, page A-6, on February 4, 1986:
http://www.sacredscience.com/baumring/interview.htm
L.A. Bookstore Speaks Volumes On Esoteric Investment Theory
Tucked away on the second floor at 2124 S. Sepulveda Blvd. (near Olympic) in Los Angeles is something the likes of which cannot be found anywhere else on this globe.
It’s the Investment Centre Bookstore, owned and operated by two men trained in fields one would think far removed from speculation in stocks, bonds or commodities.
Donald Mack, who founded the store in 1972, was educated as an engineer.
Jerome Baumring, his equal partner, was educated as a pharmacologist.
Both are self-educated in an investment theory apparently too esoteric (or slow) for Wall Street — the Gann Theory, which holds that natural laws, or recurring cycles, govern stock movements.
William D. Gann, who died in 1955, hailed from the East Texas cotton country. He had a mathematical bent — some say mystic — and that is the basis of the theory.
It’s too complex to set down in a column, or even a book, but suffice to say, in its utmost simplicity, it’s based on the view that what happened in the past will repeat.
“Nothing ever changes,” says Baumring. “Everybody makes the same mistakes throughout history. It is a battle, with timing the key.”
Gann, in a test by Ticker Magazine, made 286 trades in stocks in October 1909. He was right in 264, wrong in 22.
What is the theory forecasting now? It’s a question that makes Baumring’s eyes gleam. “The market has volcanic underpinnings,” he says. “If I make a statement about how big it could be, you wouldn’t believe me.”
Aw, c’mon, doctor, make a statement, urges a reporter.
Baumring says: “From now to the end of the third quarter, the market will be sideways or down, perhaps some 200 points (on the Dow).
Then we expect a rally [like the type we saw in] 1927 to 1929, to 3000 or more by 1988 or 1989. There will be 400 million-share days on the market.”
And then? A crash? If the 60-year Naros Cycle holds, the top will be 1989; operative also is the Kaliyuga great cycle of — get this — 25,200 years.
[That number should be very familiar by now, if you’ve been reading this book in order!]
It may sound wild, but to students like Baumring and Mack it’s the key, along with the works of restaurant accountant R.N. Elliott and Dow theorist pioneers William Hamilton and Richard Rhea.
If you visit the Investment Centre Bookstore, you’ll find all the modern stuff — “How I Made a Million,” etc. — but you’ll also find bound facsimiles of the old, rare books. They have the originals, but won’t sell them; they’re too valuable…
Here’s another excerpt from Sacred Science that helps round out the character of Baumring. It is derived from an article that appeared in the Summer 1999 issue of Trader’s World magazine:
http://www.sacredscience.com/baumring/biography.htm
There has recently been a resurgence of interest in the forecasting principles of W. D. Gann and correlatively the interpretation and explanation of Gann provided by the late Dr. Jerome Baumring of the Investment Centre.
It is common for the new (and old) student of the Gann methodologies to be overwhelmed by a mass of disordered and conflicting material regarding the mythic figure and cryptic teachings of this great market master, W. D. Gann…
Donald Mack, a highly respected market historian and scholar, founder of the Investment Centre Bookstore, stated,
“In our capacity as book suppliers to the world in our specialist area of stock and commodity books, we have met many who have been trying to fit together the pieces of the puzzle that is Gann.
However, no one to our knowledge has come close to solving the mysteries inherent to the Gann methodology except for Dr. Baumring, whom we saw evolve from his initial introduction to Gann to a complete mastery some years later.
[This was] so much so that we unequivocally state he is the only person we know of that has solved every aspect that Gann wrote about.”
Dr. Baumring was introduced to Gann while in traction recovering from a car accident which severely injured his spine (ultimately the cause of his untimely death).
While in the hospital, someone gave him a copy of Perry Kaufman‘s Commodity Trading Systems and Methods, in which is presented a copy of Gann‘s May Soy Beans chart, which caught his eye.
Dr. Baumring noticed on this chart a tiny, almost indistinguishable point and arc which had been drawn with a compass on the chart. This sparked a flame in his imagination leading him to commit the next three years — 16 hours a day, 7 days a week — to the understanding of Gann‘s trading methodologies.
It was evident to Dr. Baumring that Gann was using techniques which were not outrightly presented in his courses, and that the key to deciphering his cryptic writings lay in an understanding of “how Gann used words”.
He realized that he would have to study everything that Gann himself had studied in his time, in order to obtain a frame of reference coincident with that of the Master.
Dr. Baumring approached Donald Mack, and requested the use of his massive investment library, while accumulating an extensive personal library of old scientific, metaphysical and market works, which Gann most likely would have had access to himself.
Dr. Baumring read over 5,000 books in those years, a feat only accomplished with the help of a photographic memory and an ability to read 1,800 words a minute.
After three years of indefatigable research, even with his expertise in pharmacology and mathematics, his gift as a mechanic, and a background in Zen and martial arts, he had hit an unassailable wall.
Faced with the prospect of failure, he awoke late one night to hear an inner voice direct him to his charts. As he sat down at his chart table, this voice walked him step by step through the final barriers to understanding.
[This phenomenon, of course, is completely consistent with what we’ve been discussing throughout this book.]
After this breakthrough and its integration into a complete system which he called “Gann Harmony”, Dr. Baumring turned to the markets to prove the validity of the system.
He began with a $25,000 account and in less than two years compounded his investment into over a million dollars.
Having proven that the system was capable of producing the promised returns, he then verified that it was applicable to all markets, doing a full analysis of and trading 18 futures markets and a selection of stocks.
In order to prove Gann‘s theories on a larger scale, Dr. Baumring traded for a silver hedging company. This was the time when the gold and silver markets exploded to their all time highs.
Dr. Baumring had forecast the top of the silver market to within a three minute window, and implemented a sophisticated strategy allowing him to transition from a position 200 contracts long to a position of 200 contracts short in a screaming exponential market.
As the timing point for the top approached with the market moving as only commodities do at all time highs, a gentleman he was advising was hesitant to sell at the timing point and asked if he could wait another minute. His hesitation cost him $60,000.
In an interview in the Herald Examiner on February 4, 1986, Dr. Baumring stated,
“From now to the end of the third quarter, the market will be sideways or down, perhaps some 200 points (on the Dow). Then we expect a rally like [we saw in] 1927 to 1929, to 3000 or more by 1988 or 1989. There will be 400 million-share days on the market.”
At that time, such high volume and volatility were unheard of, but a year and a half later when Black Monday scared the pants off of Wall Street, Dr. Baumring just smiled as he had been short five S & P options from the last high, and had just made $120,000.
With his understanding of the markets now complete, Dr. Baumring began looking for another challenge. One of the unfortunate byproducts of his new understanding was the lack of people capable of communicating on a stimulating level.
Like Gann, Dr. Baumring also felt an obligation, what he often referred to as a “karmic debt”, to, as Gann said, pass on the enlightenment that had been heaped on himself in abundance…
We think it best to let Dr. Baumring describe for himself the results of his decision, so the following quotes have been extracted from his seven page announcement of a series of Courses he called The Investment Centre Stock & Commodity Courses – A Distillation of the Insights and Wisdom of W. D. Gann.
(The complete Announcement can be viewed on the Internet at www.sacredscience.com.)
“…[Since] so much… has been wrongly propagated (generally by mostly sincere people) as to what Mr. Gann‘s approach involved (such as astrology, angles, his numbered squares, cardinal crosses, and on and on), we unequivocally state that to the best of our knowledge nobody to date has ever dealt with, or has been able to even accurately explain The Law of Vibration, which Mr. Gann with great authority said was the key to explain all phases of market action.
Without properly understanding the basic laws relating to Vibration, of what value could any or all of the propagated so-called Gann concepts possess?”
“This Course begins with a thorough examination of The Law of Vibration, and thereafter progresses to Number Set Theory (Numerology), followed by the Law of Proportion as demonstrated by Geometrical applications, and going onward into the areas vital to Gann analysis such as harmonics, the mathematics of music, angles…
When the area of Angles is studied,… (we) will clear away for the first time the misuse of the technique that has been propagated as “Gann Angles”.
To accomplish this we will turn to Gann‘s own writings where he states in no uncertain terms that there is much more than just the Diagonal Angle, or as he says, ‘There are three kinds of angles – the vertical, the horizontal and the diagonal angle, which we use for measuring time and price movements‘.
Of the three, the diagonal angle is the least important.”
[You are already starting to see why he said this… we’re dealing with hidden geometric movements in the markets.]
Dr Baumring‘s approach to interpreting Gann was to follow Gann‘s clues and clear indications as to what were the necessary topics in need of understanding and application.
Gann‘s well known Ticker Interview (this full interview can be viewed at www.sacredscience.com) states very clearly that the foundations of his system were mathematics, chemistry, physics, astronomy, harmonics, natural philosophy, “the universal law of causation and harmony”, wireless telegraphy, etc., all summed up in the Law of Vibration.
[Indeed, the idea of radio signals encoding information, or “wireless telegraphy,” is an excellent way to visualize a unified field that links our minds and thoughts together.]
He was continually amazed to find that most Gann students and “experts” have very little knowledge in even one of these fields, let alone in all of them…
Dr. Baumring‘s approach was to thoroughly educate his students in every field necessary to develop an understanding of the Universal System of cause and effect founded upon the Law of Vibration…
In his lectures, Dr. Baumring would tie these principles together with demonstrations in the markets leading the student to the integration of a complete Universal System, or Cosmology.
He presented a number of perspectives and concepts which had never before been considered, though fundamental to Gann, such as the markets being, at minimum, a three-dimensional phenomena, exactly like a large molecule rotating in space, in and out of the Z plane, with DNA coding sequences governing the entire process.
[Most molecules have a simple Platonic Solid structure… such as basic salt, which forms cubes.]
Without understanding that the market is 3-D, twisting like a plant governed by the phyllotactic laws of dual number series and harmonic composition and decomposition, all measurements taken on a 2-D chart become misleading.
He translated the “mystic” terms of the esoteric tradition into modern counterparts: “astrology” becoming “numerical astrophysics, celestial mechanics, or optics”, “numerology” becoming “number set theory”, “mystic symbolism” becoming “symbolic logic”, “sacred geometry” becoming “lattice and matrix theory or the projective geometry of light”.
He often mentioned that these different branches of knowledge were merely various manifestations of One Phenomenon in differing forms of Symbolic Logic.
Dr. Baumring taught using a methodology unlike those of our modern educational systems. He believed that in order for knowledge to reside as inherent knowing, an individual must recreate the process of discovery within himself…
Now this does not mean, as many students and Gann seekers fear, that it takes some form of Divine Grace or Mystical Revelation to perceive the true workings of the market.
Rather the process of study and research develops an insight into the necessary principles of Cause and Effect, Natural Law and its manifestation in reality, which are absolute prerequisites for an integrated understanding and application.
AND NOW, BACK TO COWAN…
This is all very heady stuff, and if you want to start putting a toe in the water to read Baumring’s series of notebooks, they start at 200 dollars apiece. If you get addicted and end up wanting the whole set, it’s well over 10,000 dollars.
For some people, that might not be a problem, and these books are undoubtedly the work of a genius-level intellect. Nonetheless, this knowledge is available to everyone, and Cowan accomplished a phenomenal feat by distilling it all down into a much simpler, more affordable set of material.
There are two basic sets of books that Cowan has produced, namely Four-Dimensional Stock Market Structures and Cycles and Market Science. We own all the Cowan books and they are impressive to say the least.
We were first turned on to Cowan’s work after the early versions of this book went online in 1999. Since all the Cowan people knew each other, the word started spreading. An increasing number of Cowan’s clients contacted us on a professional basis, as they were dazzled to see how the concepts they were learning about were realized in this book. Eventually we got the Cowan books ourselves and joined the confidential discussion group.
For these Cowan clients, there is no doubt that this system works, as each of them continue to actively use these principles to play the stock market and determine where it will go next.
[Admittedly, there are also a fair number of people who order the books, try out the concepts without becoming deep students of the material, and fail to grasp how it works. The group seems neatly divided in that sense.]
Cowan does require that a non-disclosure agreement be signed in order to purchase the second series of books, Market Science, which deal with issues such as the soybean market, the musical fifth and the square of twelve, (yes, that’s 144,) as defined on Cowan’s website, www.cycle-trader.com.
The material within the first book does not require a non-disclosure agreement, however. Our publication of these concepts has already triggered waves of new interest in Cowan’sbooks — so the PR pays for itself.
Indeed, more than half of the Cowan crowd we interviewed had already made significant profits from these techniques when we spoke with them.
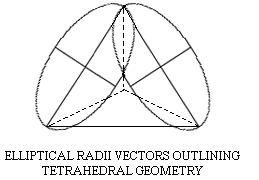
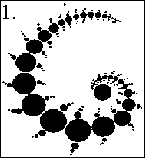
Now how does this relate to three-dimensional Platonic structures, you ask? The bottom line is that when you put Gann’s radii vectors next to each other, you start seeing geometric patterns.
Over time, it appears almost certain that Gann discovered that hidden three-dimensional energy patterns, pushing and pulling the mass consciousness on Earth, could be seen in the stock market charts.
As outrageous as this must sound, the markets move directly in line with the faces of three-dimensional Platonic solids, one face at a time. They rotate in a virtual space, all the product of the combined energy fields surrounding us. The Law of One series would say this geometry exists in “time-space”.
If you’re scratching your head trying to understand how this works, be patient. It takes time to explain it properly.
Don’t forget that each face of a Platonic Solid is the same. The tetrahedron, octahedron and icosahedron have equilateral triangles for each face.
Of course, that also means that every line on a Platonic Solid is the same length.
Sound familiar?
All equilateral triangles are built from 60-degree angles. Every angle in the equilateral triangle is 60 degrees. Gann discovered, in his ‘squared’ charts, that his ‘radii vectors’ were always joined to each other at 60-degree angles.
Baumring appears to have been the first person to decipher this from Gann’s work, and Cowan made it affordable. Once the hidden geometry was seen for what it was, it became very obvious that Gann had to have known about it, but must have kept it a secret.
The next image helps you get a visual of how this actually looks.
[When we look at the below diagram, we must remember that the ellipses that we are seeing are actually flattened out into two dimensions — and thus this is not really an honest three-dimensional graphing of what this would look like. It will, however, show us how one tetrahedral face would appear on a perfectly “squared” two-dimensional graph.]
 And so, once we throw Cowan’s work into the mix, we indeed expose how our minds here in the third dimension are being constantly affected by a truly multi-dimensional, geometric phenomenon… in time.
This should be fully expected, since we can see these same effects in space with the Global Grid… and space and time are unified in the sea of Conscious Aether.
In his books, Cowan shows us how geometric forms such as the tetrahedron, octahedron and cube reveal themselves in an “unwrapped” form upon a two-dimensional stock market graph.
Again, Cowan is telling us that the movement of a stock, in terms of its radii vectors, is being secretly controlled by a three-dimensional geometry.
Unfortunately, a market graph is not drawn in three dimensions. You only have two: price and time, Y-axis and X-axis. No Z-axis.
Therefore, a two-dimensional stock market graph can only ever be a “flattened out” version of three-dimensional action.
If you have a tetrahedron sculpture in your hand, imagine crumpling up your market graph, on paper, and folding it around the tetrahedron. You do this so that the actual movement of the graph wraps along the tetrahedron.
That’s the simplest way to imagine how a flat piece of paper is actually showing you three-dimensional action.
Cowan has proven that this is going on in his first set of books over and over again, beyond any shadow of a doubt… using real examples from the stock market. We will see a few of them as we go on.
 Perhaps what is even more amazing is what the ellipses reveal to us.
The ellipses actually trace out the path of a spiral that forms the geometric shape as it moves along.
Yes, that’s right, a spiral.
Of course, this is the same exact formation that is observed in our images of Cymatics from Hans Jenny. In these cases, we watched as the Platonic Solids emerged within the vibrations of a fluid, connected by large interconnecting spirals:

Now, we see the same harmonic, spiraling, geometric passage of energy occurring in the aetheric “fluid” of time, directly through the work of Bradley Cowan!
The ellipses that surround each of Gann’s ‘radii vectors,’ or each side of the Platonic Solid, would actually define those places where the spiral is “buckling out” of the geometric shape as it continues its rotating motion.
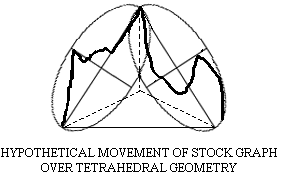
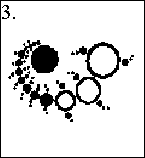
Here is an example we can reprint, with permission, from Cowan’s material showing an example of how these ellipses play out on a stock market graph:

Notice all the 60-degree angles. If you were to properly fold this graph around a tetrahedron, then you’d be able to see precisely how the action is unfolding.
Look at the first three sets of ellipses — six altogether. Those are the three main sides of the rotating tetrahedron. (The side on the bottom is not seen here, based on how it’s rotating.) Then notice the interesting focal-point that is created once the rotation has been completed, and the cycle starts again.
After the second face of the next tetrahedron turns, another cycle comes into play and blows this one out of the water. That’s the huge increase in the graph you see to the far right. Again, this is a very complicated discussion and we’re only giving you the basics of it here.
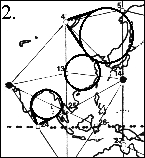
CROP CIRCLE CLUES
We should already recognize the below picture, derived from the very well-known “Triple Julia Set” crop formation that appeared literally overnight at Windmill Hill in England in 1997, as we have already printed it before with a circle around it to illustrate its outer spherical field.
Again, this diagram helps us visualize how such a spiral, based on the Julia Set fractal, would formulate a tetrahedron.
All straight lines and triangles were not in the formation but rather drawn in afterwards, aligning with the shape that the collection of spiraling circles suggested.
Furthermore, if we also inserted an inverted mirror-image of the crop formation over this same diagram, we would observe the formation of ellipses that are literally identical to those envisioned by Cowan and visually modeled in the Cymatics experiments of Dr. Jenny:
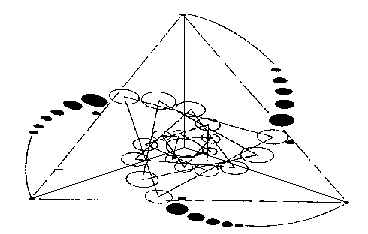
Diagram by Ed and Kris Sherwood, reprinted with permission.
And if we briefly look back to the spatial distortions of the Global Grid again, as seen in our study of “Grid Circles,” we can see circular, unfolding “fractal” spirals in the formation of island chains and continent borders. Furthermore, an overlay from the Stonehenge Julia Set formation in 1996 reveals almost the exact same fractal shape:
 |
 |
 |
Since the ETs delineated the simple spirals as actually fractal formations, we believe that this is showing us how there can be very large and very small levels of Platonic solids that smoothly interconnect with each other. This fits in perfectly from a quote from the Law of One series:
The term density is a, what you call, mathematical one. The closest analogy is that of music, whereby after seven notes on your western type of scale, if you will, the eighth note begins a new octave.
Within your great octave of existence which we share with you, there are seven octaves or densities. Within each sub-density are seven sub-sub-densities. Within each sub-sub-density, seven sub-sub-sub-densities and so on infinitely.
To see this effect occurring with fractals, the Mandelbrot Set certainly could be expanded into three dimensions just like Cowan has done with the stock market graphs, thus revealing the spherical structure of the different aether densities within itself.
And one of the most fundamental qualities of any fractal is that it is composed of spiraling lines that will show the same formations over and over again as you zoom in on them.
These spirals would naturally form the Platonic geometries within themselves as they unfold, as the previous crop circle diagram suggests.
What we have learned from Cowan’s clients is that lower-order cycles will show up in tetrahedra and octahedra, which in our system are the geometries of the fourth and third densities or dimensions, respectively.
However, far longer-term cycles emerge as cubical formations in the market, which would be those of the fifth density.
Once again, Cowan shows that the longer-term radii vectors of the graphs can be shown to trace a path over a rotating cube over the course of many years.
It would make sense that the cube would take longer to show up than the lower-order shapes, as the cubical geometry of the fifth dimension is of a far higher vibration than the tetrahedron of the fourth.
Furthermore, Cowan teaches us that the four-way or “square” division of the 84-year orbital period of the planet Uranus precisely defines the time units that form each side of this basic “market cube” as it unfolds!
This is the first big clue that we have to indicate that the orbits of the planets themselves are tracing out these geometric forms in free space, forms which have very active effects on the structure of space/time as we perceive it.
And according to Cowan’s research, a stock trader does not want to tangle with this cube. Based on Cowan’s advanced calculations that combine price and time as a whole, both the Crash of 1929 and 1987 could be predicted in advance, practically down to the day, by this cubical structure.
Here is a graph we reprint, with permission, from Cowan’s series, showing the cube in action

Remember… we are not giving enough information here for you to properly critique this design one way or the other. A great deal of space in the series is devoted to explaining how this functions.
As of May 1999, the potential for the next major downward trend had begun, in terms of geometry, though it has not been as steep as the others thus far — but even as the first edition of this book is going online in April of 2000, the market is experiencing jitters unprecedented since the Crash of 1987.
[Indeed, the actual value of the economy appears to have been consistently dropping since this time… the cyclical equivalent of the Great Depression. One way to measure it is in the incredible increase in gasoline prices during this time.]
TETRAHEDRAL ACTION
This next image is discussed in great detail in Cowan’s books. We only place it here so as to give you an idea for how this tetrahedral action appears on a chart.
Each triangle you see is one of the faces as the tetrahedron rotates

PLANETARY ACTION
Another aspect of Gann/Cowan’s discoveries that is difficult to grasp, at first, is the fact that in many cases, you have to combine the orbits of two major planets together, and then watch how their combined ratios, one to the other, affect the markets.
One of the nifty things about the harmonics of our Solar System is that many of these cycles mesh perfectly with one another.
We specifically chose the Saturn-Uranus cycle — the dance of two neighboring planets — because the way in which they tug at our collective consciousness is so unbelievably obvious:

COMPOSITE CHARTS
It gets even better. When you begin combining all the different planetary motions together, in terms of how they push and pull, it is possible to unify them into one single chart of activity. This is called a “composite chart.”
The similarity between Cowan’s composite chart, and the actual movement of the market, is nothing short of breathtaking:

WHY “FOUR-DIMENSIONAL?”
The last bit of information regarding Bradley Cowan’s works that we need to mention at this time is why he calls these stock market cycles “four-dimensional.”
The reason for this is that in three dimensions, you cannot predict the future… merely study the past and observe the present.
However, by accurately deducing the structure and movement of these higher-order geometries in advance, it is indeed possible to move outside of linear time — and predict the future with great accuracy.
Therefore, since the geometries indeed forecast events that have yet to occur, they can be considered as fourth or even fifth-dimensional in their structure.
THE GANN-COWAN CONNECTION
Here’s a very interesting punch line to the story. Several different investigators have studied reincarnation cases, including our own colleague Joe R. Myers at www.reincarnation2002.com.
In these alleged reincarnation cases, you expect to see striking facial similarities as well as very notable similarities in character.
Is it possible that Cowan could be the reincarnation of W.D. Gann? We thought so from the very first time we ever saw his photograph on the same page as Gann’s.
Now, in our 2007 rewrite, we’ve worked up a comparison photo so you can judge for yourself. Gann’s image has been flipped horizontally to make it easier. Imagine Cowan with a higher collar, similar glasses and a frown on his face, and you have a striking similarity!

Thus, it may very well be that the soul of Gann decided to return, dramatically simplify his work, and remove much of the secrecy that surrounded it. We are happy to be a part of that process either way.
GALACTIC GEOMETRIES IN TIME: THE WILCOCK CONSTANT
One of Wilcock’s most significant original discoveries in “harmonic aether physics” occurred when he happened to come across an astrophysics professor’s webpage.
He originally discovered this page in his search for information on the interesting phenomenon of dark matter.
The first significant point that David noticed was that the entire galaxy is spinning as a single unit, meaning that the outside portions travel at the same relative speed as the inside portions, just like a single, connected disc.
Obviously this is not the case in our own Solar System, as in order for Pluto to move at the same relative speed as Mercury, it would have to travel at a tremendous velocity.
Therefore, our current astrophysicists have postulated that the only way that our Galaxy could spin in unison like this would be if a sphere-shaped field of matter named the “Galactic Halo” exists around it.
However, since we cannot see this halo, they have called it “dark matter” and insist that it must be there.
And now, based on our understandings of the harmonic aether, we can clearly see that this is unnecessary — it is a simple property of the spherical harmonics of aether vibration that is at work.
As David inspected this page, he came across a number that he had never before been made aware of. In previous manuscript versions of this book, he had alluded to the fact that there must be a comparable Galactic cycle to what was seen in the Nineveh cycle.
However, at the time he was unaware that there were any numbers for the length of the Galactic rotation that were precise enough to make any calculations. On the professor’s website the number was clearly given: the galaxy rotates once approximately every 225,000,000 years.
David was immediately excited when he saw the number. The first thing that he did was to see if this number could be turned into seconds and thus derived in a similar way to the Nineveh Constant, from the “vibrations” of seven and six.
He calculated that there were a total of 31,556,926.08 seconds in a year by multiplying 86,400 per day times 365.2422 days.
By multiplying this number into the 225 million-year orbit of the Galaxy, he could get a ballpark for exactly how many seconds this would be.
Then, he eventually realized that if he took 0.7, not 70, and multiplied it by 60 nine times in a row, he came up with a number that was very, very close — a “harmonic” Galaxy orbit of exactly 7,054,387,200,000,000 (or roughly 7 quintillion) seconds in length.
Once he had this number, he then simply had to multiply it by 365.2422 to get the exact number of years that it would be — and thus a true “harmonic year” of the Galaxy became 223,544,814.9201 million years in length.
The fact that .7 multiplied by 60 nine times in a row could be 223.5 million, when the professor’s figure was set at 225 million, was already quite stunning.
David knew that when small numbers are multiplied into large numbers, each successive expansion in size would make it more and more difficult to naturally arrive at such a close correspondence by sheer chance. In other words, he was “on to something big.”
David took a deep breath as he realized the next step.
In order to see if everything worked out properly, he would have to take the exact length of the Nineveh Constant in years and divide it into the “master harmonic number” for the Galaxy.
This was the moment of truth. If the resulting value turned out to be non-harmonic, then there would be nothing left of the theory — the entire effort would have crumbled apart.
David had clearly seen what the true “harmonic” value of the Galaxy’s orbit was, and that it was based again solely on the vibrations of seven and six — so there was reason to believe that it should amount to something.
However, this didn’t change the fact that David was nervous — if the calculator showed a meaningless number, then he knew that the theory was either seriously flawed or completely wrong. It was a moment that might never happen again in his life the same way.
In order to get to the “moment of truth,” he had to calculate the Nineveh Constant in years, by taking its total value of 2,268 million days and dividing it by 365.2422.
From this, the exact number of years in one Nineveh Constant turned out to be precisely 6,209,578.192224, or roughly six million years.
Then, all that was left was to take this number and divide it by the “harmonic” length of the Galaxy’s orbit, at 223,544,814.9201 years.
By the time David got to this point and had set up the final calculation, he had already accepted that it probably wasn’t going to be anything significant. He was ready for the letdown, ready to go back to the drawing board, ready to start all over again from scratch.
He was almost disappointed in himself as he prepared to hit the ENTER key, waiting for the messy number to appear on the screen. After all, anything but a messy number would be a complete miracle.
He took a deep breath, closed his eyes, and pressed ENTER.
Click.
He opened his eyes.
In the window of the calculator shone two digits, and to David’s eyes they were as bright as the Sun:
36.
David’s entire body went completely numb. Suddenly he burst out of the chair and found himself screaming at the top of his lungs with joy, jumping, shaking his arms and racing around the room- there could be no mistake. “Oh my GOD, oh my GOD, oh my GOD, I can’t believe it! Thank you GOD!”
The Master Harmonic Number, 36, had appeared right before his eyes as if by magic!
It was the Crown Jewel, the Holy Grail, the ultimate proof that the Harmonic Universe Theory was real.
David now knew that our planets come into a perfect straight line exactly 36 times in a row, for every rotation of the galaxy.
The majesty and harmony of the wheelwork of the Creation was exposed. The answer was more beautiful, more elegant than David could have ever possibly imagined. He almost couldn’t believe that he was the first one on the planet to have discovered this.
[Since this time, mathematicians have told us it “should have been obvious” by simple factoring, without having to go through all these tedious steps. Fair enough. This roundabout method is how the discovery came into being.]
When he finally came to his senses, he had to check the soon-to-be-named Wilcock Constant against the value for the precession in the Nineveh Constant, which in this case turns out to be 25,873.2424676 years long, fairly close to the 25,920-year “harmonic ideal” value.
To his amazement, the number was exactly 8640!
In other words, everything worked exactly like a clock.
There are 3600 seconds in an hour and 86,400 seconds in a day.
Similarly, there are 36 Nineveh cycles and 8640 precessional cycles in a “Galactic Year”. Everything worked out — just like a clock.
Now, when he went back to the Ra Material, he knew what they were talking about. First, the quote from Session 9:
Thus, each of your planetary entities is on a different cyclical schedule as you might call it. The timing of these cycles is a measurement equal to a portion of intelligent energy. This intelligent energy offers a type of clock.
The cycles move as precisely as a clock strikes your hour. Thus, the gateway from intelligent energy to intelligent infinity opens regardless of circumstance on the striking of the hour.
Then, the quote from Session 13:
The spiraling energy, which is the characteristic of what you call “light,” moves in a straight-line spiral thus giving spirals an inevitable vector upwards to a more comprehensive beingness with regards to intelligent infinity…
The fourth density is, as we have said, as regularized in its approach as the striking of a clock upon the hour. The space/time of your solar system has enabled this planetary sphere to spiral into space/time of a different vibrational configuration…
Then, the quote from Session 14:
Imagine, if you will, the many force fields of the Earth in their geometrically precise web. Energies stream into the Earth planes, as you would call them, from magnetically determined points… the various geometrical centers of electromagnetic energy which surround and shape the planetary sphere.
Then, the quote from Session 15:
Love creating light, becoming love / light, streams into the planetary sphere according to the electromagnetic web of points or nexi of entrance. These streamings are then available to the individual who, like the planet, is a web of electromagnetic energy fields with points or nexi of entrance.
Here, David knew that they were speaking of the chakras. Earlier in this same session, Ra had said the following:
The thought-form distortions of your peoples have caused the energy streamings to enter the planetary magnetic atmosphere, if you would so term this web of energy patterns, in such a way that the proper streamings are not correctly imbued with balanced vibratory light / love from the, shall we say, cosmic level of this octave of existence.
And then, the quote from Session 17:
The fourth density is a vibrational spectrum. Your time / space continuum has spiraled your planetary sphere and your, what we would call galaxy, what you call star, into this vibration.
This will cause the planetary sphere itself to electromagnetically realign its vortices of reception of the in-streaming of cosmic forces expressing themselves as vibrational webs so that the Earth thus be fourth-density magnetized, as you may call it…
And then, the case was sealed with the quote from Session 63, started by a question from Dr. Elkins that seemed to pop “out of the blue:”
Q: Is there a clock-like face, shall I say, associated with the entire major galaxy so that as it revolves it carries all of these stars and planetary systems from density to density? Is this how it works?
RA: I am Ra. You are perceptive. You may see a three-dimensional clock face or spiral of endlessness which is planned by the Logos for this purpose.
WHY THREE CYCLES OF 25,000 YEARS, NOT ONE?
At this point, the only remaining step was to find a reason for why Ra insisted that the key figure for our planetary evolution was three cycles of precession, not one.
David returned to the figures from Cotterell, and saw that one full rotational cycle of the fortune cookie-shaped “neutral sheet” surrounding the Sun had been calculated at 18,139 years.
This was obviously too big of a number to fit in together with 25,920 years, which would be one precessional wobble of the Earth.
David knew that three precessional cycles added up to 77,760 years.
Then, he realized that if Cotterell’s number was increased from 18,139 years to 18,140, which is a perfectly possible and excusable adjustment, making the number far more harmonic, then four of these cycles would add up to precisely 72,560 years.
And 77,760 minus 72,560 was 5200 — again, the same “shift cycle” seen on so many smaller levels with impressive redundancy, based on the harmonics of the number 13!
We remember that this even included the difference between the number of J-S conjunctions in one Mayan Calendar as opposed to their harmonic katun counterparts.
David then decided to see how many three-precessional cycles would occur in one full harmonic rotation of the Galaxy.
He was hardly surprised to see that the number came out to 2880– the exact harmonic of “double light” and the first ratio in the common Diatonic scale.
In short, everything that Ra had said about the essential structure, function and architecture of the Universe was true — and therefore, the actual harvest itself was also a legitimate reality.
And then, David thought back to the remarkable internal timeline structure of the Great Pyramid, which Ra had given to humanity as their greatest blessing — a structure believed to be the perfect form for initiation and healing.
And as he again studied the Timeline, he realized that the remarkable metaphysical qualities of harmonic time and the Shift of the Ages had been built-in all along!


![DECLAS: Social Media Nukes An Entire Generation… But Why? [Free Ebook!]](https://divinecosmos.com/wp-content/uploads/2019/06/DECLAS_TT-150x150.jpg)


I have only read as far as chapter 19. As I ponder what I have read, I wonder this- the exploding rates of autism and autism spectrum “disorders” lately. Could these be 4th dimension souls? Ascending souls? The timing would be right. My 4 year old autistic niece spots me tracing repeating geometric patterns in the sand. I don’t know why I do this, but have a habit of drawing a repeating pattern- like a five pointed star. My autistic niece stares at my pattern creations in the sand, smiling. I wonder about the two of us. My sister says- there goes your aunt drawing her patterns. I didn’t even realize that this was a thing with me. My autostic niece looks alive and focused and full of recognition.
Hi Carol, you make remember something I have been doing unconsciously tracing repeating geometric patterns of the five pointed star since from my college, I keep on repeating them all over my note books. I don’t know why I do this too. But now as a trader I begin to have some ideas related to it and I started studying the secredgeometry and W. D. Gann’s work. I hope I will find some answers.